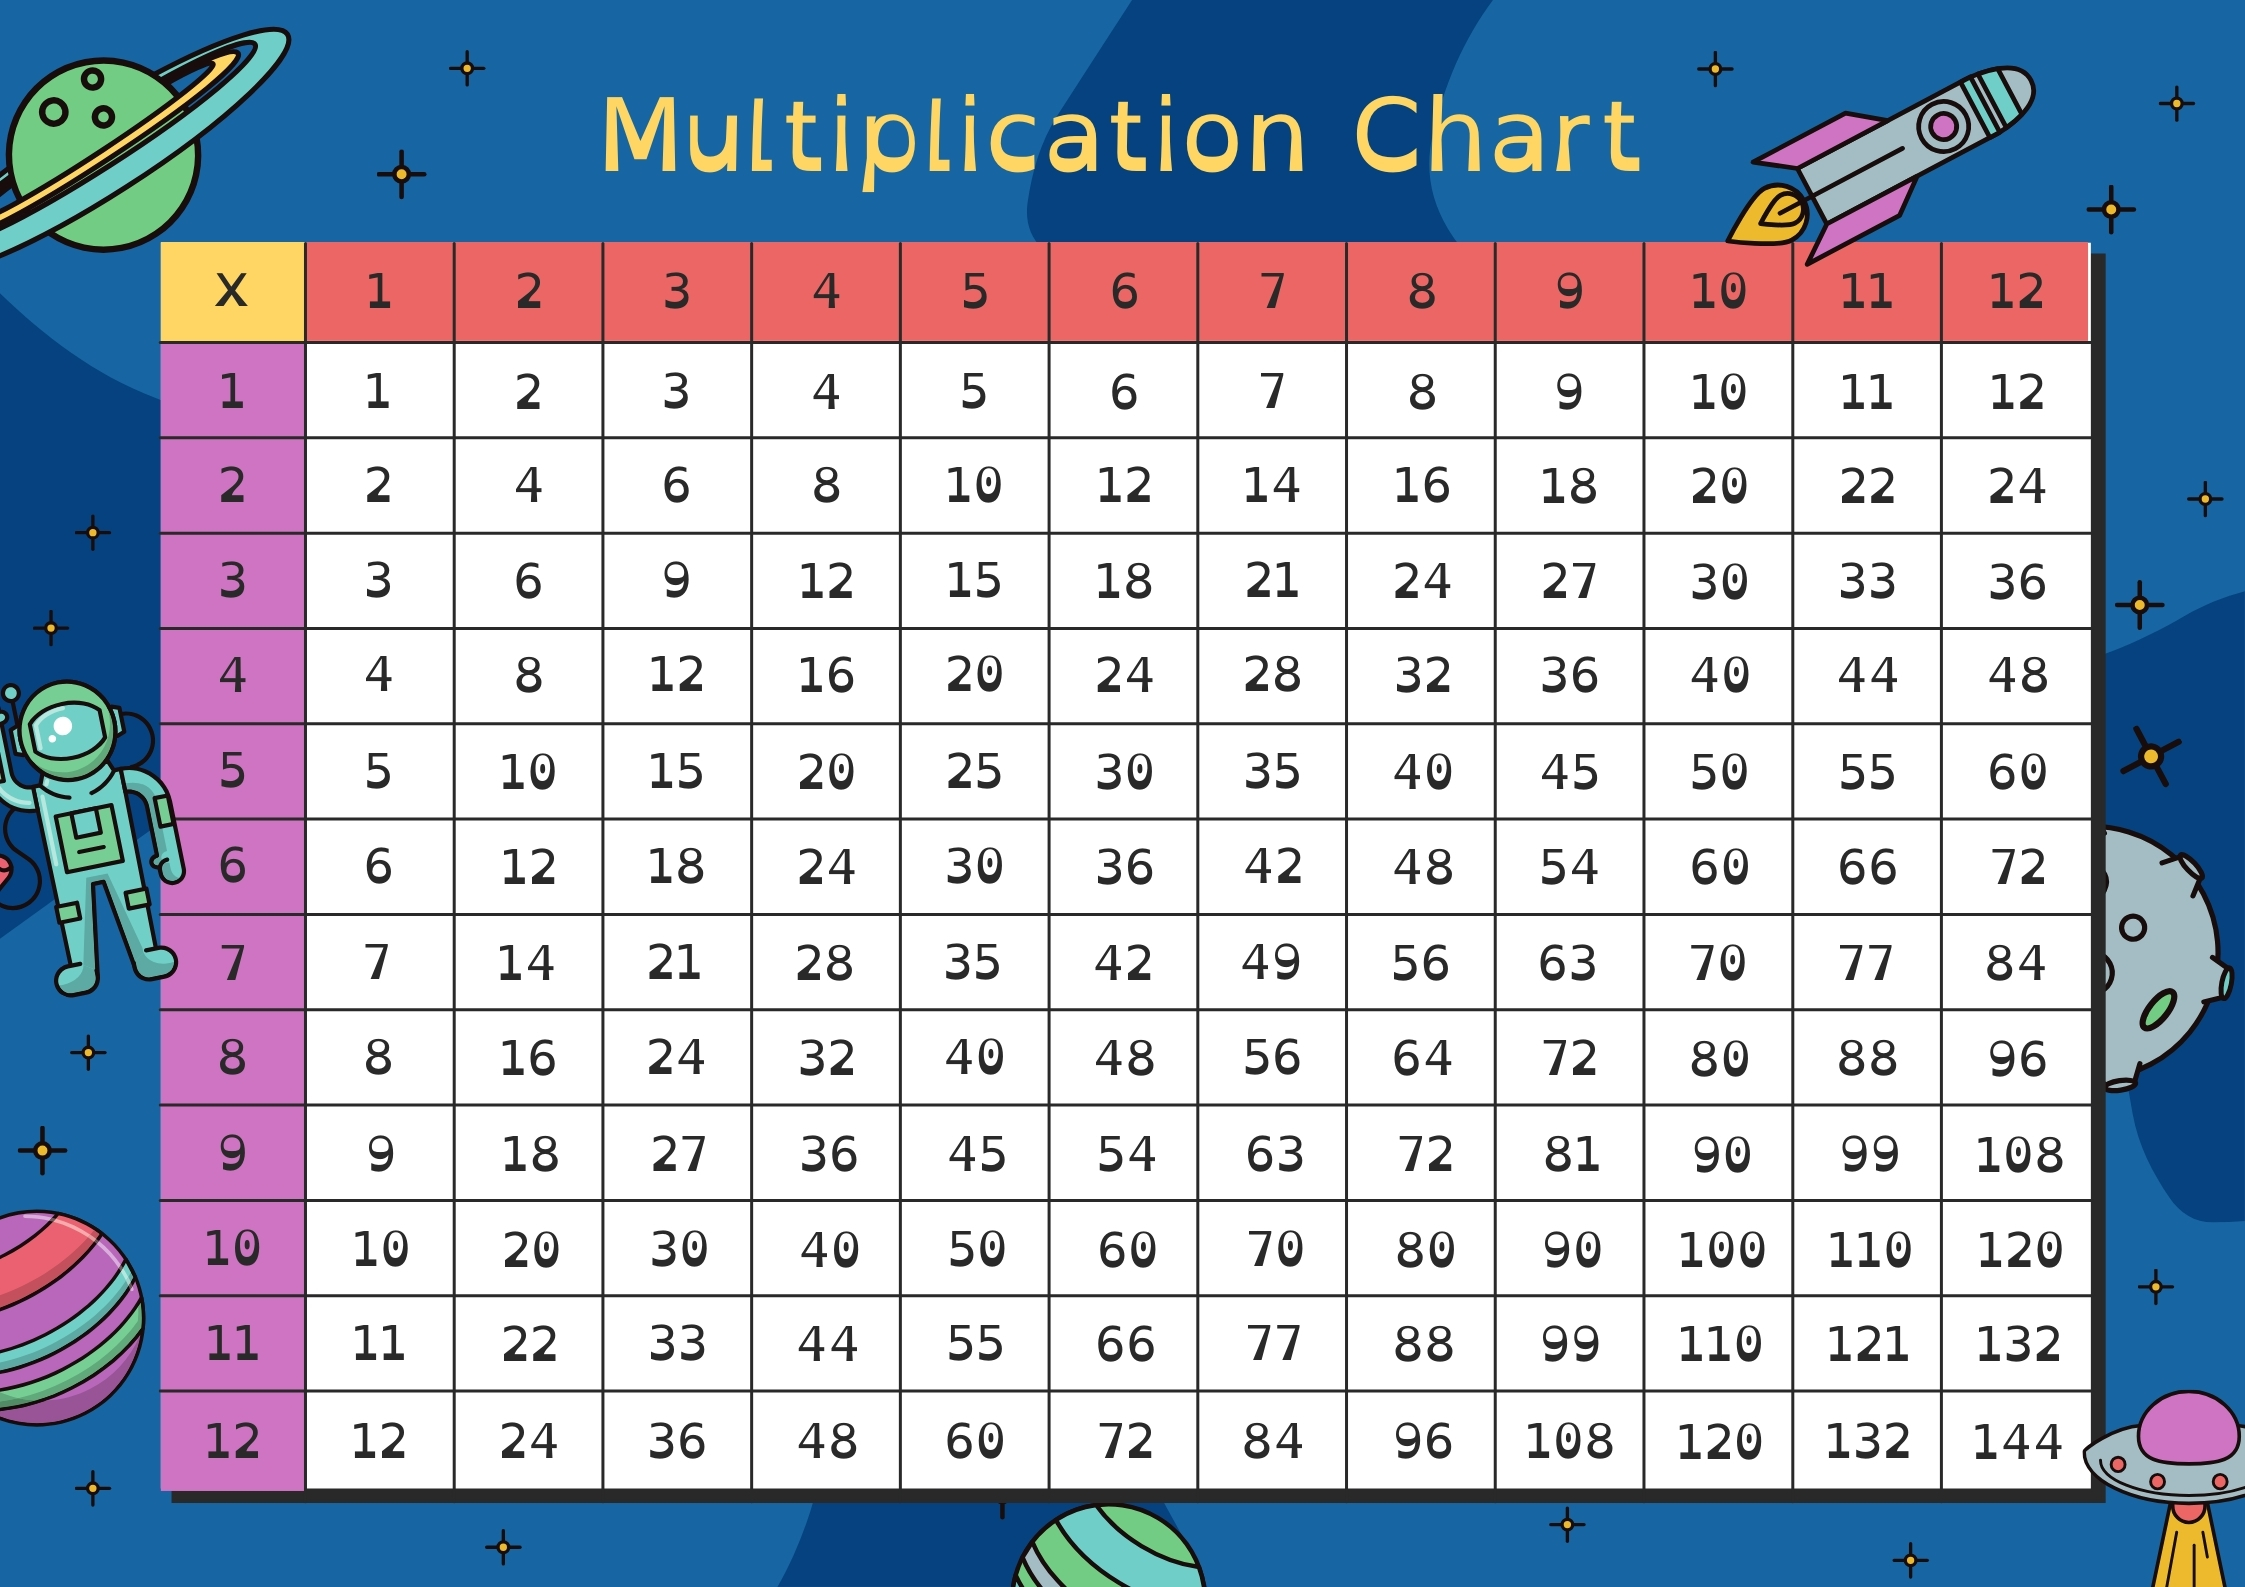
A Multiplication Chart 1-12 is a grid displaying the products of numbers from 1 to 12. It’s a visual tool that helps students, particularly younger learners, quickly reference and understand multiplication facts. The chart is organized in a way that both the row and column headers represent numbers 1 through 12, and the intersection of these headers shows the product of multiplying the two numbers. This chart is a foundational tool for mastering basic multiplication, which is a core mathematical skill necessary for more complex problem-solving.
Related Posts
Purpose and Usage of a Multiplication Chart
The primary purpose of a multiplication chart is to simplify and speed up the learning of multiplication facts. It offers a visual way to grasp the relationships between numbers and how their products change. The chart is widely used in schools, tutoring sessions, and even at home by students who are learning their times tables. Teachers also incorporate the chart into lessons to strengthen their students’ multiplication skills through practice and drills.
For students, having this chart allows them to avoid memorizing every single multiplication fact through rote memorization. Instead, they can understand how multiplication works by observing patterns in the chart. For example, students quickly notice that multiplying by 1 results in the same number, multiplying by 10 simply adds a zero, and the product of identical numbers (e.g., 6 × 6) lies diagonally on the chart.
How to Read a Multiplication Chart
Reading a multiplication chart is straightforward once you understand the layout. The chart is a square grid with numbers from 1 to 12 across the top row and down the first column. To find the product of two numbers:
- Locate the first number on the top row.
- Locate the second number on the left-hand column.
- The intersection of these two points on the chart gives the product.
For example, to multiply 6 × 7:
- Find 6 on the top row and 7 on the left column.
- The intersection of row 6 and column 7 will display 42, meaning 6 × 7 = 42.
Patterns in a Multiplication Chart
Multiplication charts are not just about memorizing facts; they also reveal patterns that can deepen understanding. Some common patterns include:
- Symmetry: The chart is symmetrical across the diagonal, meaning 4 × 7 equals 7 × 4. This reinforces the commutative property of multiplication.
- Multiplying by 1: The entire first row and first column display the numbers 1 through 12, showing that multiplying any number by 1 gives the same number.
- Multiplying by 10: Multiplying any number by 10 simply adds a zero to the number. This can be seen in the 10th row and column.
- Multiplying by 5: Every product in the 5th row or column ends in either 0 or 5, showing a clear and predictable pattern.
- Square numbers: The diagonal from the top-left to the bottom-right shows the squares of numbers (e.g., 4 × 4 = 16, 5 × 5 = 25), useful for recognizing perfect squares.
Why is a Multiplication Chart Important?
A multiplication chart provides a foundation for future math concepts, such as division, fractions, algebra, and even geometry. Multiplication itself is a building block for many mathematical operations, and the chart helps solidify these basics early on.
Additionally, quick recall of multiplication facts is essential in timed tests and higher-level math where mental math is often required. Using a multiplication chart to practice speeds up this recall process. The chart also aids in learning division since division is the inverse operation of multiplication (i.e., if 4 × 3 = 12, then 12 ÷ 3 = 4).
Multiplication Chart in Real Life
Beyond the classroom, knowing multiplication is vital in everyday tasks like calculating prices, making measurements, and managing finances. For instance, if you know that a single item costs $8, and you need to buy 7 of them, you can quickly calculate that 8 × 7 = 56. Similarly, cooks, builders, and engineers use multiplication frequently to scale recipes, measure materials, or estimate quantities.
Learning Multiplication Through the Chart
There are different ways to incorporate a multiplication chart into learning:
- Memorization: While some students use the chart for quick lookup, others use it as a tool for gradual memorization. Repeated exposure to the chart helps embed multiplication facts in memory.
- Games and Drills: Many teachers incorporate the chart into games or timed drills to make learning more engaging. For instance, students can cover parts of the chart and challenge themselves to fill in the blanks.
- Problem-Solving: Students can use the chart as a reference while solving more complex word problems or equations, allowing them to focus on the problem-solving process rather than recalling multiplication facts.
Tips for Using a Multiplication Chart
- Start small: When introducing students to a multiplication chart, it’s helpful to start with smaller numbers (1-5) and gradually introduce larger ones.
- Practice skip counting: Skip counting (e.g., counting by 2s, 5s, or 10s) helps students understand the concept of multiplication more intuitively. It shows how numbers build progressively, which is visible in the rows and columns of the chart.
- Use real-world examples: Incorporating real-life scenarios, such as calculating money or measuring ingredients, can make the use of multiplication charts more practical and relatable.
Conclusion
The Multiplication Chart 1-12 is a simple yet powerful tool for mastering multiplication facts, helping students build a strong foundation in math. It aids not only in understanding multiplication itself but also in recognizing patterns and relationships between numbers. By using this chart, learners can improve their speed, accuracy, and confidence in mathematics, all while making the learning process more engaging. Whether it’s for school, work, or everyday tasks, mastering the multiplication chart sets the stage for mathematical success.
